Calculate Call Center Staffing with Excel
This guide explains how to optimize the number of agents to reach the desired service level. This guide applies to call centers and contact centers. The theory is illustrated with Microsoft Excel. Advanced notes are available for software developer who would like to reproduce the theory into a custom application.
Download: erlang-by-lokad.xls (Microsoft Excel Spreadsheet)
When opening the spreadsheet, Excel will warn you than this document contains macros. Those macros correspond to the Erlang-C formula (see explanation below). You need to activate the macros in order to reproduce the calculations.
Modeling the inbound call activity
The inbound call activity can be modeled with a few variables:
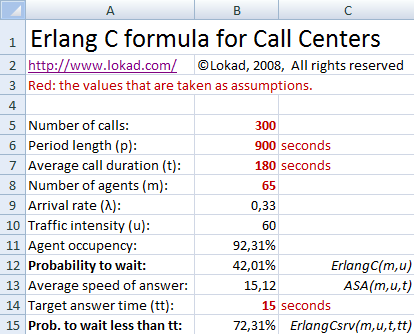
- The average call duration noted t is known. t is located on B7.
- The number of agents, noted m is known. m is located on B8.
- The call arrival rate, noted λ is known. The arrival rate is the number of incoming calls per second. In the spreadsheet, λ is located on B9.
In the following, based on those 3 variables, plus a couple of statistical assumptions, we will be able to compute
- the average agent occupancy.
- the probability that a call has to wait.
- the probability that a call waits for more than a specified time.
The most important statistical assumption is that the incoming calls behave statistically like a poisson process. Without entering too much into the details, this assumption is reasonable if the call events are mostly independent.
Counterexample: if we consider the case of a call center that receive calls from viewers trying to answer a question on TV show game; then clearly the Poisson assumption is not going to hold because all the calls get simultaneously triggered by the same event (the TV show).
Computing indicators with Erlang
Based on the assumptions introduced in the previous section, we will now calculate a couple of insightful indicators that reflect the call center activity.

The period length represents the duration of the time window being considered for the analysis. In the illustration here above, it’s 900s which is to say 15min, a very frequently used aggregation level among call centers.
The traffic intensity is a number that represent the minimal number of agents that are required to address all the incoming calls. If there are fewer agents than the traffic intensity, then mechanically, calls will be dropped. The traffic intensity is named u and be computed as the product of the call arrival rate λ multiplied by the average call duration t. In the spreadsheet, the traffic intensity is computed in B10.
The average agent occupancy (or utilization) is a ratio that expresses the amount of time spend by the agents actually answering call compared to the total time (which might include idle periods for the agents). The agent occupancy can be simply computed by dividing the traffic intensity u by the number of agents m. In the spreadsheet, the agent occupancy is computed in B11.
The probability to wait (from the caller viewpoint) expressed the probability that an agent will be readily available (i.e. idle) to answer an incoming call. This value is obtained through the Erlang-C formula - unfortunately, the fine-print of the Erlang-C formula is beyond the scope of this guide1. In the sample spreadsheet, the probability to wait is computed in B12 using the ErlangC macro function implemented in Visual Basic. The ErlangC function takes two arguments, first m the number of agents and second u the traffic intensity.
The average speed of answer (ASA) represents the average wait time for a call. The ASA computation is based on the Erlang-C formula. In the sample spreadsheet, the ASA is computed in B13 using the ASA macro function implemented in Visual Basic. The ASA function takes 3 arguments, first m the number of agents, second u and third t the average call duration.
The probability to wait less than a target time is self-explanatory. Like for the probability to wait, the detail of the actual formula is beyond the scope of this guide. In the sample spreadsheet, the probability is computed in B15, the desired wait time (i.e. target time), named tt, being provided in B14. The computation is using the function ErlangCsrv which takes 4 arguments: first m the number of agents, second u the traffic intensity, third t the average call duration and fourth tt the target time.
Practical staffing with Excel
In the previous sections, we have seen how to compute useful indicators to analyze the call center activity. Yet, the Excel layout (see screenshot here above) was chosen for the sake of clarity, and is not suited for practical call center staffing.
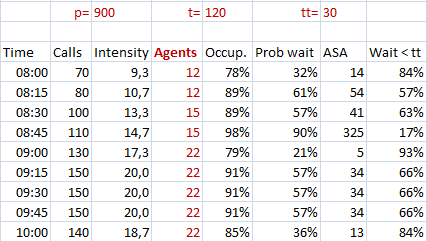
In this section we propose to use a much more compact layout illustrated in the screenshot below.

Within the sample spreadsheet, the upper-left corner of illustration here above is the cell E2 (the cell is empty). The computations performed in this table are just the straightforward application of the formulas introduced in the previous section.
A couple of remarks
- we assume constant average call duration t and constant target time tt.
- we use static Excel cell reference, i.e. $A$1 instead of A1 for the variables (which facilitate cut-and-pasting the formulas).
- agent counts can be freely optimized to adjust the expected service levels.
- cell format properties are adjusted to avoid displaying to many decimals.
License
Permission is hereby granted, free of charge, to any person obtaining a copy of this software and associated documentation files (the “Software”), to deal in the Software without restriction, including without limitation the rights to use, copy, modify, merge, publish, distribute, sublicense, and/or sell copies of the Software, and to permit persons to whom the Software is furnished to do so, subject to the following conditions:
The above copyright notice and this permission notice shall be included in all copies or substantial portions of the Software.
THE SOFTWARE IS PROVIDED “AS IS”, WITHOUT WARRANTY OF ANY KIND, EXPRESS OR IMPLIED, INCLUDING BUT NOT LIMITED TO THE WARRANTIES OF MERCHANTABILITY, FITNESS FOR A PARTICULAR PURPOSE AND NONINFRINGEMENT. IN NO EVENT SHALL THE AUTHORS OR COPYRIGHT HOLDERS BE LIABLE FOR ANY CLAIM, DAMAGES OR OTHER LIABILITY, WHETHER IN AN ACTION OF CONTRACT, TORT OR OTHERWISE, ARISING FROM, OUT OF OR IN CONNECTION WITH THE SOFTWARE OR THE USE OR OTHER DEALINGS IN THE SOFTWARE.
Notes
-
A cursory Google search will yield highly instructive resources - even Wikipedia has a solid article on the matter. ↩︎