ABC XYZ analysis (Inventory)
ABC XYZ analysis, much like its predecessor ABC analysis, is a categorization tool aimed at identifying the best performing products in one’s catalog so one can determine appropriate service and safety stock levels. Unlike ABC analysis, which focuses exclusively on a single criterion (typically sales volume or revenue), ABC XYZ analysis attempts to also quantify a second dimension (demand uncertainty or volatility). Despite perhaps providing a slightly higher resolution snapshot of performance, ABC XYZ analysis is still a naïve application of the underlying mathematical principles and merely serves to amplify bureaucracy and instability. It also retains all the limitations of a classic ABC analysis but arguably provides an even greater sense of false security through mathematical flimflam.

Performing an ABC XYZ Analysis
While an ABC analysis aims to financially decompose an array of SKUs into one of three classes across a period of time,1 thus providing a supply chain practitioner with a breakdown of SKUs by financial importance, ABC XYZ analysis purports to go one step further. It attempts to understand and quantify the demand variance (or volatility) for each SKU across the observed period, and to merge the classic A, B and C-classes with additional X, Y and Z ones. Simply put, demand variance is a measure of how much demand changed across the observed period. This could reflect unexpected and/or isolated periods of extremely high (or low) demand, or a sustained overall difficulty in predicting how many units of a SKU were really needed (or any other reason demand might have fluctuated across the time frame). This variance is what the X, Y and Z designations are intended to capture.
Under this new nine-category rubric, X-class SKUs are the most stable (experience the least demand variance), Y-classes somewhat stable (experience moderate demand variance), and Z-classes the most unstable (experience the most demand variance). Building on the classic ABC analysis, a supply chain practitioner is presented with a seemingly more nuanced breakdown of one’s catalog across the time frame, where SKUs are analyzed across twice as many dimensions.
In order to process the new classification, a supply chain practitioner follows the same initial steps as the classic ABC analysis. Once this stage is completed, one progresses to the XYZ portion of the analysis, where one requires:
- The desired number of demand variance classes: usually limited to 3, though this is flexible.
- A threshold for separating each class: entirely at the discretion of the supply chain practitioner. An example might be <=10% for X-class, >10-25% for Y-class, and >25% for Z-class.
- The average for each SKU across the observed period: easily calculated in any spreadsheet.
- The standard deviation and coefficient of variance for each SKU: also easily calculated in any spreadsheet.
The standard deviation, in the context of a year’s worth of data, is usually how much sales in any given month differed from the overall monthly average for the year. Once a supply chain practitioner has this information, they can calculate the coefficient of variation (CV). Also known as the relative standard deviation, CV is a percentage value of how far from the mean a given data point is which, in this case, represents how great the fluctuation in sales was for a SKU across the observed period (compared to the mean). This percentage value is obtained by dividing the standard deviation by the average.
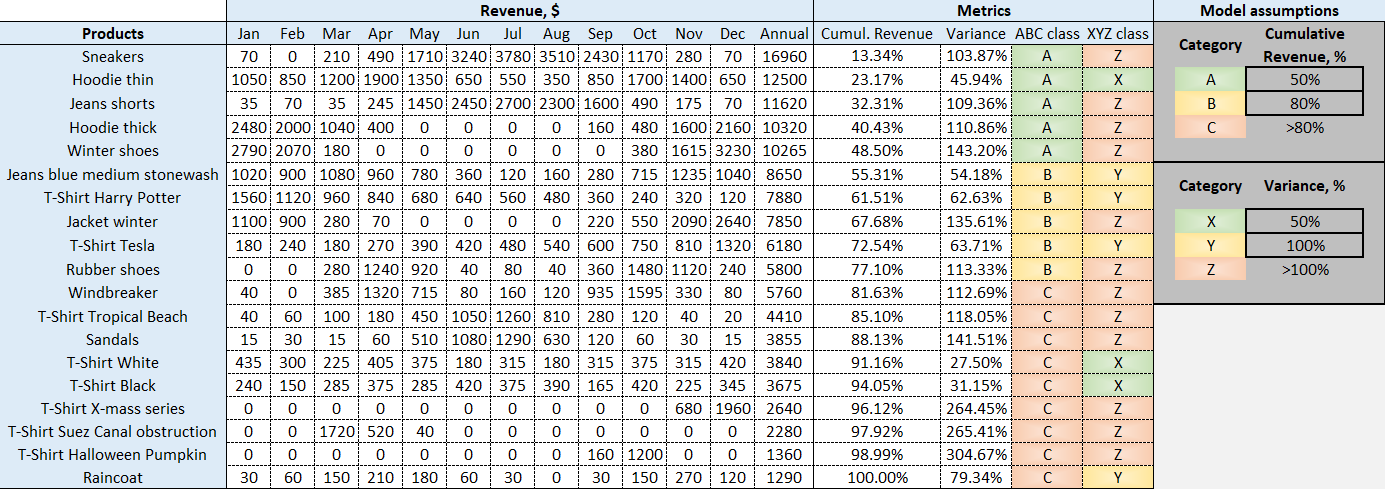
Once the CV is computed, the supply chain practitioner sorts the SKUs into their respective X, Y and Z-classes in line with their predetermined thresholds. This results in a nine-category matrix where SKUs are sorted in terms of their revenue and demand variance.

Figure 1. A model ABC XYZ analysis, as featured in the downloadable Excel spreadsheet. For explicit calculations, please consult the formulas within relevant columns.
Download the Excel spreadsheet: abc-xyz-analysis-tool.xlsx
The mathematical perspective on ABC and ABC XYZ
From a purely mathematical perspective, whether implicitly or explicitly, both ABC and ABC XYZ analyses attempt to leverage the concept of moments, which is an infinite set of quantitative measures aimed at mapping a function. In the present context, the function is a distribution of sales data, and the moments of interest are the first two: mean for traditional ABC analysis; mean and variance for ABC XYZ analysis. In terms of ABC analysis, given it focuses on only the first moment (mean), it would be more accurate to call this method a moving average segmentation. Fundamentally, there is no attempt to identify the uncertainty of demand. For this reason, ABC XYZ analysis attempts to leverage the second moment (variance) to quantify this uncertainty. This makes ABC XYZ analysis more akin to a moving average-variance segmentation method. Unlike mean, which is popularly understood, variance is a little less colloquial. Succinctly, it represents how dispersed a set of values – here, average monthly sales data — is from the set’s average value. ABC XYZ utilizes this additional mathematical tool to arrive at an allegedly more complex understanding of a data set’s variation. How effectively these tools are applied will be revisited in Limitations of ABC XYZ.
How ABC XYZ analysis informs inventory policy
Textbook applications of ABC XYZ analysis, much like ABC analysis, center around assigning service levels and safety stock targets. Using the new ABC XYZ matrix, a supply chain practitioner can, in theory, better visualize the SKUs of interest and, thus, tweak inventory policies to reflect not only revenue concerns but the forces of demand variance.
Safety stock
An immediate application of ABC XYZ is better safety stock targets. One’s A-class SKUs naturally receive the highest levels, but, unlike ABC analysis, there is an attempt at differentiating between members of the A-class (resp. C) using the XYZ classes along the x-axis. This is where proponents of ABC XYZ analysis argue the approach shines brightest, and four extremes of immediate interest will be analyzed below through this lens.
- AX: These SKUs generate high revenue and experience low variance. As such, a supply chain practitioner might decide that lower levels of safety stock are needed than the other A-class SKUs, in order to achieve high service level targets.
- AZ: These SKUs may generate equally high revenue as AX and AY ones, but experience significantly more demand variance. As a result, higher levels of safety stock might be deemed prudent.
- CX: These SKUs generate low profit and experience low variance. Low levels of safety stock would likely be the chosen course of action (relative to AX, AY, AZ, BX, BY and BZ).
- CZ: These SKUs not only generate low profit, but experience elevated levels of demand variance. From a supply chain perspective, these SKUs represent the worst of both worlds. Such SKUs would, theoretically, have low safety stock levels and be prime candidates for possible discontinuation.
As a general rule of thumb, ABC XYZ analysis indicates that SKUs require more safety stock as one moves along the x-axis, commensurate with the increased difficulty to predict demand (with CZ SKUs being a notable exception, as described above).
Service levels
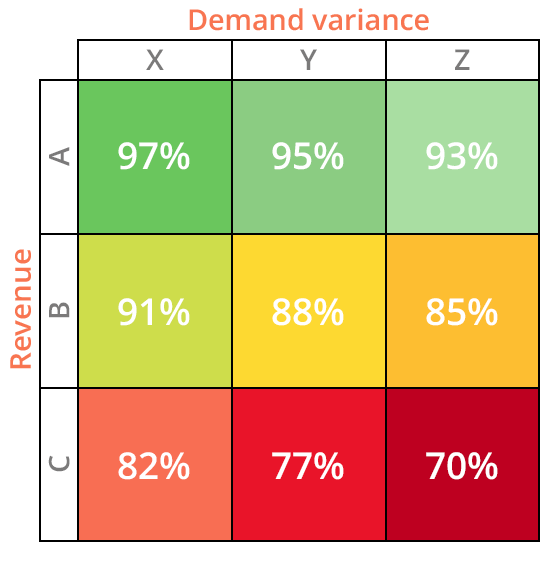
Intuitively, maintaining service levels on one’s A-class SKUs is of primary importance, though one might opt to have lower levels as one moves across the x-axis. For example, AX SKUs would likely have a higher service level target than AZ ones, given the reduced demand variance associated with the former versus the latter. As one moves down the y-axis, service level targets are typically lowered, and, as one might expect, a sensible policy would see CZ SKUs receive the lowest service level targets of all nine categories.

Figure 2. A model ABC XYZ matrix with revenue on the y-axis and demand variance on the X-axis. This matrix displays potential service level targets for each designation, with levels depreciating as revenue drops and demand variance rises.
Limitations of ABC XYZ
Despite arguably providing (slightly) greater insight into one’s catalog, ABC XYZ analysis is an attempt at evolution that retains all the limitations of ABC analysis while providing precious little substance. Plainly, it is innovation without import, and it is not uncharitable to suggest it even invents additional classes of drawback ABC analysis lacked.
Practical objections to ABC XYZ
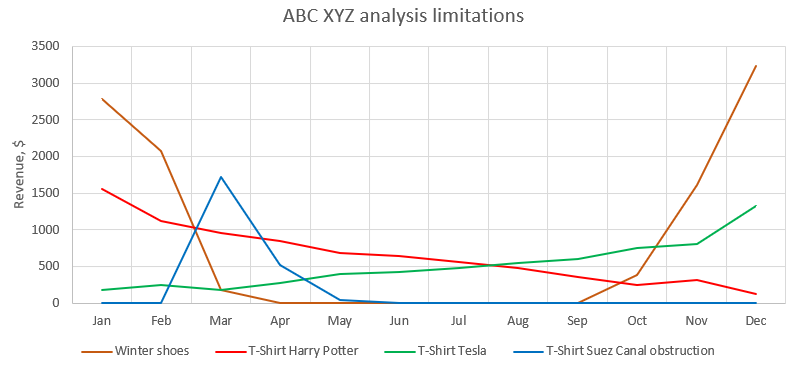
- Low resolution: Exactly as per ABC analysis, the nine categories of an ABC XYZ matrix miss demand patterns such as rising versus falling trends (see Harry Potter and Tesla t-shirts in Figure 3), limited offerings (see Suez Canal t-shirt), and seasonality (see winter shoes). As a result, the impact these can have on one’s inventory policies goes completely uncharted. This limitation also presupposes the supply chain practitioner has not arbitrarily opted for even more classes along each axis, which is entirely possible given the laissez-faire nature of the approach.

Figure 3. The line graph demonstrates the edge cases that ABC XYZ analysis missed in the model data set. For example, both Harry Potter and Tesla t-shirts finished as BY-class SKUs and would receive the same service level and safety stock targets. This ignores the fact that the SKUs are demonstrably trending in completely opposite directions.
-
Increases instability: ABC XYZ analysis extends the arbitrary and unstable categorization created by ABC analysis. The real dollars and cents difference between CZ and CY, or BZ and even BY, could be vanishingly small, if not almost financially unnoticeable. Not only that, just like in an ABC analysis, these practically imperceptible differences could shift depending on the selected time horizons. For example, a SKU could oscillate between AZ and CZ simply by expanding or contracting the selected time frame (e.g., monthly versus quarterly versus yearly horizons). Much like the selection of nine categories described above, there is no more or less sense in choosing a greater or smaller time frame.2 As such, setting service level and safety stock targets based on such unstable inputs is deeply flawed.
-
Increases bureaucracy: By definition, the unstable categories described above require management to intervene and establish distinct policies for each one. This, unfortunately, results in even more bureaucracy generated and bandwidth squandered. Just as the difference between an A and B-SKU might be a single percentage point (or mere handful of dollars), the CV differential between Y and Z-class SKUs might be faint at best. These parameters are completely arbitrary and ultimately determined by committee, hence they are of questionable provenance. Bearing in mind that SKUs can easily shift between the nine categories throughout the observed period (regardless of where they may finish it), setting arbitrary service levels based on this information not only creates unnecessary administration and meetings, but also increases the likelihood of costly stockout events. Furthermore, many, if not most, of the chefs involved in setting these arbitrary parameters will lack the requisite mathematical training to parse the approach, let alone be able to meaningfully contribute to the numerical recipes. This criticism is expanded in Theoretical objections to ABC XYZ. It should also be highlighted that, despite the increased categorization and bureaucracy, ABC XYZ analysis does not actually identify why certain products are difficult to forecast – such as CZ SKUs. Rather, it simply determines that they are difficult to forecast, and management is left to quibble over which safety stock formulas to arbitrarily apply to these chance categorizations.
-
Lacks financial perspective: At its core, ABC XYZ analysis is predicated upon a first order approach to economic drivers. In short, this mindset considers SKUs only in terms of their direct margin contributions. Though ABC XYZ appears to also consider demand variance, its foundation is still based on how much each SKU contributes in an individual, direct sense (e.g., revenue). This approach views SKUs in isolation rather than combination. This nuance is the hallmark of a second order approach, where the value of a CX SKU, for example, is considered in relation to an AX one. Though the former may not contribute significant revenue, having it in stock may facilitate the sale of the latter, thus the CX’s indirect value may vastly outweigh its direct one. Therefore, an already arbitrary categorization process, which results in equally arbitrary inventory policies, is completely blind to these subtle economic drivers. This will almost certainly result in instances of stockout events for SKUs whose true worth has not been realized.3
Theoretical objections to ABC XYZ
On its face, ABC XYZ analysis may seem like a superior iteration of the classic ABC approach, with people perhaps swayed by the apparent application of semi-advanced mathematical principles. This impression is undeserved, however, as ABC XYZ’s adoption of moment theory is naïve, given the implicit statistical analysis it seeks to perform is incomplete. While it is fair to say that mean and variance are valid parts of a mathematical analysis of this type (i.e., understanding the distribution of a random demand variable), there are other equally instructive moments that are completely overlooked.
The third moment, skewness, is not featured in an ABC XYZ analysis, nor is the fourth, kurtosis. How evenly (or not) one’s sales are distributed around the mean is measured by skewness.4 Kurtosis, meanwhile, measures how “peaked” or “flat” the distribution is in comparison to a normally distributed data set. Both these moments provide valid insights into the underlying data, precisely why a robust statistical analysis would feature them as standard practice.5
As a result, the validity of the statistical investigation in an ABC XYZ analysis is unfinished at best and misleading at worst. In fact, the nature of modern computing and statistical techniques is such that there is no need to limit one’s scope to only four moments, thus even a theoretical future iteration of ABC XYZ that incorporates these moments would still be underpowered by comparison.
Lokad’s take
ABC XYZ analysis is, ultimately, an unnecessary and misguided attempt at improving ABC analysis. Setting aside the inherent limitations of the ABC classification, the XYZ calculations fail to yield meaningful insights given how misunderstood its research question is and how inappropriate its chosen tools are to execute it.
ABC XYZ aims to help practitioners identify appropriate inventory policies for difficult-to-forecast SKUs (e.g., AZ or CZ) without identifying why these SKUs might be difficult to forecast. Moreover, it fails to provide any granular perspective on how SKUs interact (their indirect worth), which plays a crucial role in determining nuanced service level and respective stock level targets. By ignoring these concerns, the analysis is essentially groping about in the darkness.
In terms of underlying tools, the approach doubles the arbitrary parameters of its predecessor, and triples the number of classes, while incorporating a partially literate grasp of statistics. This transgression cannot be ignored, however well-intentioned ABC XYZ proponents may be. The potential peril lies in the patina of rigor the XYZ calculations present readers. Unlike ABC analysis, which is accessible to just about anyone with a working computer and functioning brain, ABC XYZ purports to leverage a few statistical principles that, to the uninitiated, can appear quite advanced and impressive. This, however, is a buzzword-crutch that does not support its own weight. A proper statistical analysis of sales data is possible using moments, however it requires a much more sophisticated understanding of moments than one finds in ABC XYZ analysis.
In fine, ABC XYZ analysis sacrifices statistical robustness to remain accessible to the general supply chain practitioner. This tradeoff results in a process that amplifies instability and distracts users from the underlying issues of interest. Practitioners whose businesses have outgrown such practices are welcome to email contact@lokad.com to arrange a demonstration of a production grade PIR solution – Lokad’s answer to the problems ABC XYZ attempts to solve.
Notes
-
Typically, A, B and C-class SKUs, where A represents the most profitable, C the least, with B somewhere between. The time frame is ordinarily a calendar year, but this can vary. ↩︎
-
Granted, there is a lower limit to utility; selecting a single week’s worth of data would be of almost no probative value. However, once one has determined a data set of sufficient historical depth (say, 3 months of sales), there is almost no logical objection to the suggestion it could stand to be increased by another month. The result of this would, as mentioned above, almost certainly shift some SKUs’ placements in the ABC XYZ matrix. This serves to underline another problem with the ABC XYZ process: once one has reached a probative mass of data, the process is immediately vulnerable to further noodling. This stands in opposition to what a categorization is intended to do: provide robust and meaningful boundaries between entries. ↩︎
-
This is a very brief summary of Lokad’s perspective and foreshadows stockout cover as a crucial economic driver. Both of these concepts are expanded upon in our prioritized inventory replenishment tutorial. ↩︎
-
Or “SKU-ness” if you prefer. ↩︎
-
Just as pi contains an infinite number of digits, a probability density function has an infinite number of moments of different order. However, in practice, generally only the first four are used. ↩︎